Overview
This vignette replicates Figure 3 in A framework to map fishing activity from incomplete data (DOI: 10.1093/icesjms/fsag070), accepted to ICES Journal of Marine Science.
Load SWIM example shapefiles
These files are stored on Zenodo at https://zenodo.org/records/18165445.
sw_example_shapefiles(FALSE) #TRUE will create a folder to save these files in your working directory
#> Fetching SWIM example shapefiles from https://zenodo.org/records/18165445.
#> ℹ Number of records: 1
#> ℹ Successfully fetched list of published records - page 1 (size = 10)
#> ✔ Successfully fetched list of published records!
#> ✔ Successfully fetched record for id '18165445'!
#> Found 6 files in zenodo record 18165445

rm(coast_coarse)#We only need some of them for this vignette

ls()
#> [1] "buffer10" "buffer30" "buffer50" "nafo_4t"  "ref_grid"

# crop the buffer shapefiles to the nafo shapefile
buffer10<-crop(buffer10,nafo_4t)
buffer30<-crop(buffer30,nafo_4t)
buffer50<-crop(buffer50,nafo_4t)
Assign events to spatial grid cells.
The example data file sampling.weights contains a column
of spatial grid cell identities and a column of sampling weights
according to distance buffers.
head(sampling.weights)
#>   OBJECTID weight
#> 1   255891      1
#> 2   256996      1
#> 3   256997      1
#> 4   256999      1
#> 5   258104      1
#> 6   258105      1
Use function sw_sample to assign 10,000 events to
spatial grid cells.
set.seed(12345)

len=10000

x1<-sw_sample(len,sampling.weights,option=1)#Option 1 = based on weighted random sampling
#> Returning grid cell identities resulting from weighted random sampling

x2<-sw_sample(len,sampling.weights,option=2)#Option 2 = distribute over ALL grid cells according to weight
#> Returning data frame of the sampling weight, the number of associated spatial grid cells, and the number of events per grid cell

x3<-sw_sample(len,sampling.weights,option=3)#Option 3 = distribute over ALL grid cells evenly
#> Returning data frame of number grid cells and the number of events per grid cell
Compare outputs from the three options.
head(x1)
#> [1] 351939 347278 332847 273856 335121 268184
x2
#> weight cells n.per.cell
#> 1 0 2394 0.00000000
#> 2 0.01 1903 0.04530052
#> 3 0.15 3172 0.40766187
#> 4 1 4553 1.89340867
x3
#> cells n.per.cell
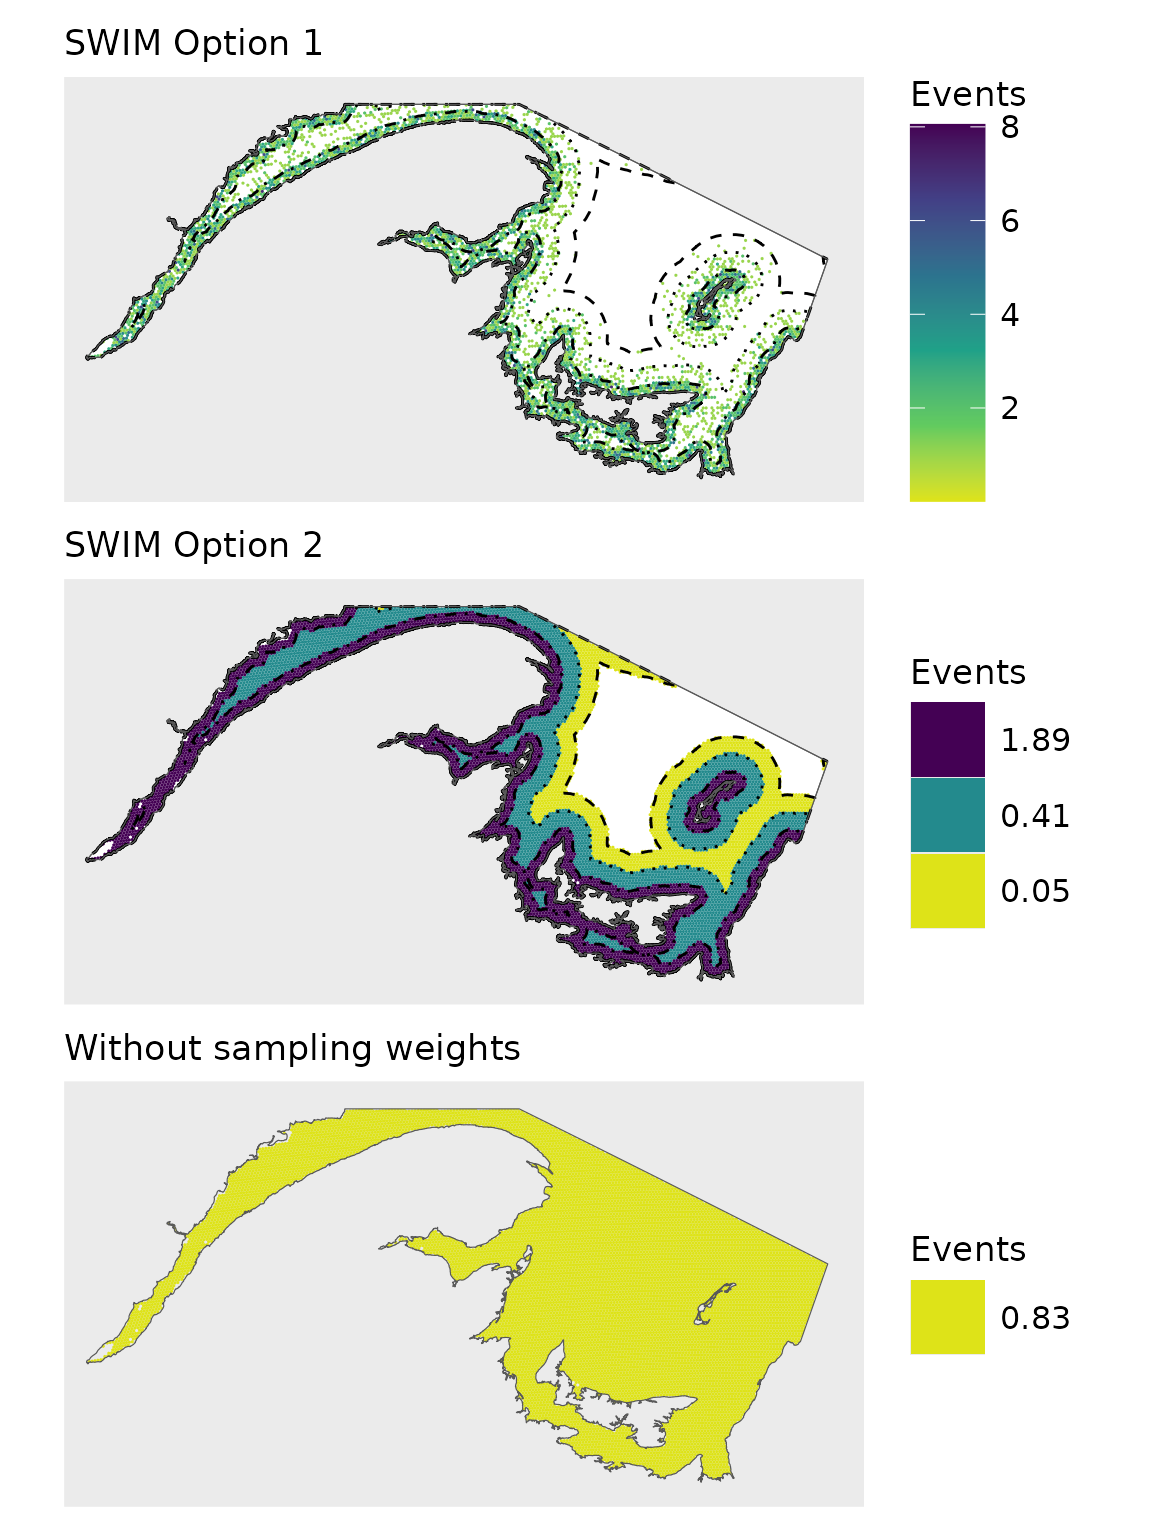
#> 1 12022 0.8318084Plot 1
#tally per hex
x1b<-cbind.data.frame(table(x1))
names(x1b)<-c('OBJECTID','count') #use same grid cell identity column header as shapefile
head(x1b)
#>   OBJECTID count
#> 1   256996     3
#> 2   256997     2
#> 3   256999     2
#> 4   258104     3
#> 5   258105     3
#> 6   258106     2

grid.1b<-merge(ref_grid,x1b)

pl1<-ggplot()+
    geom_spatvector(data=nafo_4t,fill='white')+
    geom_spatvector(data=grid.1b,aes(fill=count),col=NA)+
    geom_spatvector(data=buffer10,fill=NA,col='black',linewidth=0.5,linetype=4)+
    geom_spatvector(data=buffer30,fill=NA,col='black',linewidth=0.5,linetype=3)+
    geom_spatvector(data=buffer50,fill=NA,col='black',linewidth=0.5,linetype=2)+
    scale_fill_viridis_c(name='Events',option='viridis',direction=-1,
                         limits=c(0.01,8.05),
                         begin = 0,end = 0.95)+
    geom_spatvector(data=nafo_4t,fill=NA)
Plot 2
names(x2)[3]<-'count'
grid.2<-ref_grid
grid.2$count<-0
buffers<-list(buffer50,buffer30,buffer10)#km
counts<-c(0.05,0.41,1.89)
for(i in 1:length(buffers)){
  buf<-vect(buffers[i])
  index<-intersect(buf,grid.2)
  grid.2[which(grid.2$OBJECTID%in%index$OBJECTID),'count']<-counts[i]
  }

grid.2<-grid.2[which(grid.2$count>0),]
label2<-rev(round(unique(grid.2$count),2))

pl2<-ggplot()+
    geom_spatvector(data=nafo_4t,fill='white')+
    geom_spatvector(data=grid.2,aes(fill=factor(count)),col=NA)+
    scale_fill_viridis_d(name='Events',option='viridis',direction=-1,
                         labels=label2,
                         begin = 0,end = 0.95)+
    guides(fill = guide_legend(reverse = TRUE))+
    geom_spatvector(data=buffer10,fill=NA,col='black',linewidth=0.5,linetype=4)+
    geom_spatvector(data=buffer30,fill=NA,col='black',linewidth=0.5,linetype=3)+
    geom_spatvector(data=buffer50,fill=NA,col='black',linewidth=0.5,linetype=2)+
    geom_spatvector(data=nafo_4t,fill=NA)
Plot 3
x3
#>   cells n.per.cell
#> 1 12022  0.8318084
grid.3<-ref_grid
grid.3$count<-x3[,2]

label3<-round(unique(grid.3$count),2)

pl3<-ggplot()+
    geom_spatvector(data=grid.3,aes(fill=factor(count)),col=NA)+
    scale_fill_viridis_d(name='Events',option='viridis',direction=-1,
                         begin = 0,end = 0.95,
                         label=label3)+
    geom_spatvector(data=nafo_4t,fill=NA)
Combine
Set up
CRS<-'epsg:4269'

map.theme<-list(coord_sf(crs=CRS,xlim=c(-71,-60),ylim=c(45.55,49.5)),
                theme(panel.grid.major = element_blank(),
                      panel.grid.minor = element_blank(),
                      axis.text = element_blank(),  # Remove axis text
                      axis.ticks = element_blank(), # Remove axis ticks
                      axis.title = element_blank()  # Remove axis titles
                ),
                theme(
                  legend.title = element_text(size = 13),
                  legend.position = "right",
                  legend.text = element_text(size = 12),
                  legend.key.size = unit(1, "cm"),
                  legend.justification = "left",
                  legend.box.margin = margin(l = 0.05, unit = "cm")   ))
Plot
(big.plot<-(pl1+map.theme+ggtitle('SWIM Option 1'))/(pl2+map.theme+ggtitle("SWIM Option 2"))/pl3+map.theme+ggtitle("Without sampling weights"))